Rémi Pauchet
6fcb9de6cb
add RC filter graph
Rémi Pauchet
6fcb9de6cb
add RC filter graph
|
il y a 4 ans | |
|---|---|---|
| doc | il y a 4 ans | |
| JDS6600.py | il y a 4 ans | |
| README.md | il y a 4 ans | |
| SDS1202XE.py | il y a 4 ans | |
| bode.ipynb | il y a 4 ans | |
| bodeplot.py | il y a 4 ans | |
| requirements.txt | il y a 4 ans | |
| retry.py | il y a 4 ans |
README.md
Bode plot
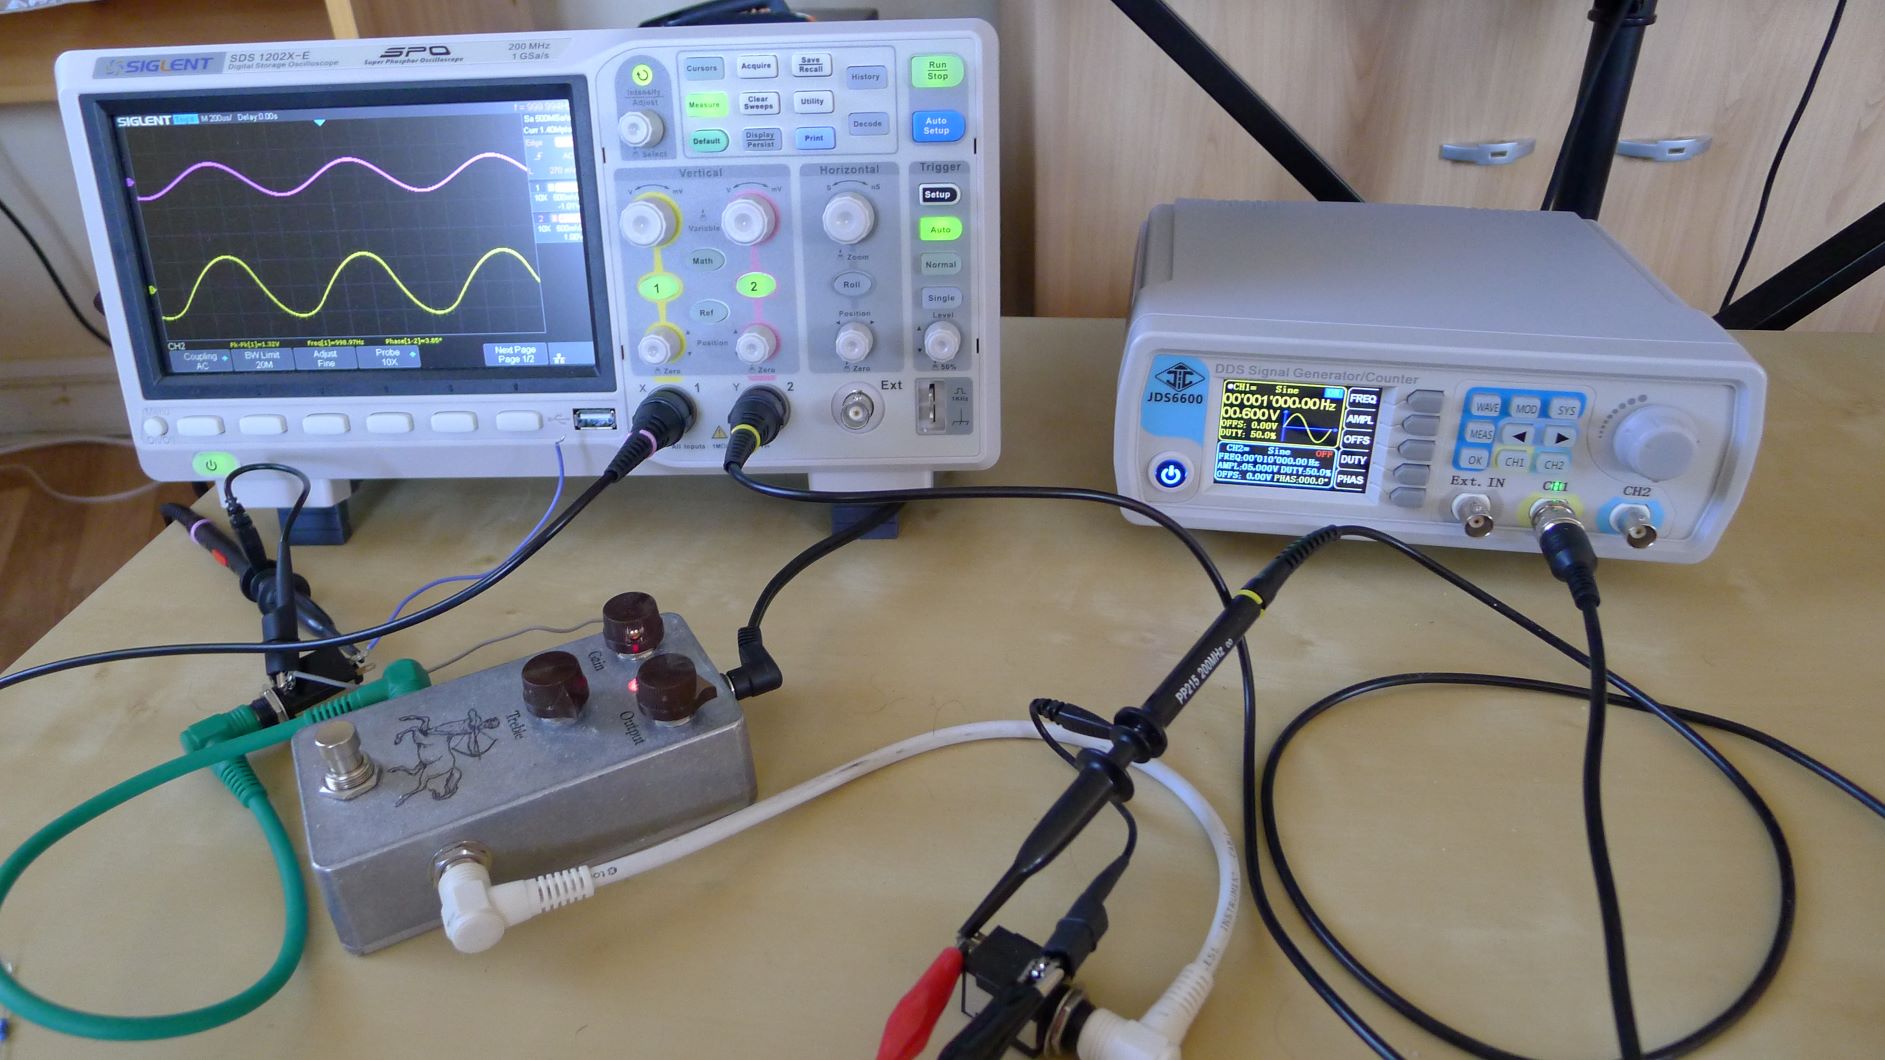
This python notebook allows to analyse the frequency response and trace the bode plot of a device (guitar pedal, filter, ...)
The script connects to the a Siglent osccilloscope and a JDS6600 via NI-VISA or serial and issue SCPI commands.
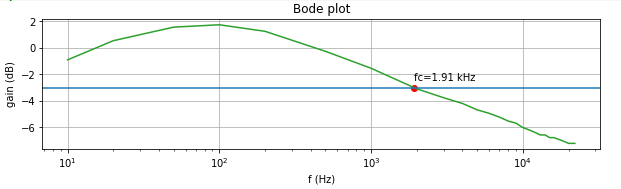
RC filter
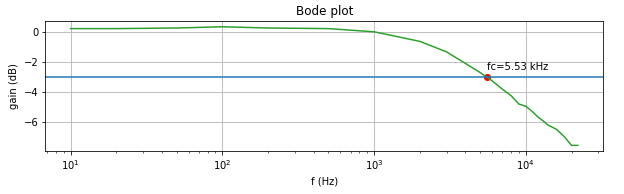
Klone with tone at the maximum